Stock Market Performance 15-Jan-2025: The KSE 100 Index experienced a slight decline today, closing at 114,495.70, down by 308.46 points (-0.27%). Despite starting the day strong, the market faced selling pressure in the latter half, leading to a dip from the previous close of 114,804.16. The index’s intraday high reached 115,773.39, while the low touched 114,298.29, indicating a relatively narrow trading range.
Market participation remained consistent with a volume of 263,604,730 shares, slightly higher than yesterday’s activity. However, the year-to-date (YTD) change showed a marginal decline of -0.55%, reflecting cautious investor sentiment. The 52-week range remains between 59,191.86 and 118,735.10, showcasing significant long-term growth potential.
KSE 100 Index Table:
| Metrics | Values |
|---|---|
| Closing Value | 114,495.70 |
| Change | -308.46 (-0.27%) |
| High | 115,773.39 |
| Low | 114,298.29 |
| Volume | 263,604,730 |
| 1-Year Change | +78.15% |
| YTD Change | -0.55% |
| Previous Close | 114,804.16 |
| 52-Week Range | 59,191.86 – 118,735.10 |
Top Active Stocks
Among the top active stocks, WTL led the chart with a volume of 68,666,714 shares, closing at 1.80, up by 0.02 points (1.12%). PRL followed closely, trading 56,858,715 shares, with its price rising by 1.99 points (4.80%), closing at 43.49. CNERGY also saw significant activity, with a volume of 43,218,561 shares, but its price dropped slightly by 0.15 points (-2.08%), closing at 7.06.
Investors remained focused on oil, gas, and energy-related stocks, which saw mixed performance due to global crude oil price fluctuations. However, the overall interest in these sectors indicates robust market activity.
Top Active Stocks Table:
| Symbol | Price | Change | Volume |
|---|---|---|---|
| WTL | 1.80 | +0.02 (1.12%) | 68,666,714 |
| PRL | 43.49 | +1.99 (4.80%) | 56,858,715 |
| CNERGY | 7.06 | -0.15 (-2.08%) | 43,218,561 |
| TRG | 68.78 | +2.59 (3.91%) | 29,668,408 |
| HASCOL | 12.32 | -0.20 (-1.60%) | 23,576,635 |
| KEL | 4.91 | -0.09 (-1.80%) | 20,043,975 |
| FFL | 17.10 | -0.32 (-1.84%) | 17,813,006 |
| CPHL | 70.82 | +4.19 (6.29%) | 14,000,265 |
| FLYNG | 24.68 | -0.17 (-0.68%) | 13,314,654 |
| HUBC | 131.18 | +3.37 (2.64%) | 13,012,938 |
Top Advancers: Stock Market Performance 15-Jan-2025
The day’s top advancer was FECM, which climbed 0.77 points (13.58%) to close at 6.44, though on a low volume of 5,040 shares. PASM followed closely, gaining 0.50 points (11.11%) to end at 5.00, with a volume of 36,472 shares. Other notable performers included SERT, which surged by 1.38 points (10.04%), closing at 15.13.
Check out the Prvious Day PSX Performance 14 January 2025
The strong performance of these stocks highlights positive sentiment in specific industries, driven by favorable earnings reports and market speculation.
| Symbol | Price | Change | Volume |
|---|---|---|---|
| FECM | 6.44 | +0.77 (13.58%) | 5,040 |
| PASM | 5.00 | +0.50 (11.11%) | 36,472 |
| SERT | 15.13 | +1.38 (10.04%) | 149,372 |
| POWERPS | 12.29 | +1.12 (10.03%) | 1,500 |
| GUSM | 11.65 | +1.06 (10.01%) | 27,702 |
| BFBIO | 231.30 | +21.03 (10.00%) | 2,981,826 |
| SHEZ | 136.06 | +12.37 (10.00%) | 96,244 |
| DNCC | 14.74 | +1.34 (10.00%) | 571,705 |
| LSEFSL | 17.49 | +1.59 (10.00%) | 124,559 |
| OTSU | 186.36 | +16.94 (10.00%) | 136,867 |
Top Decliners: Stock Market Performance 15-Jan-2025
On the declining side, UVIC recorded the steepest drop, losing 1.08 points (-10.01%) to close at 9.71, with a volume of 107,496 shares. OML followed with a loss of 3.87 points (-9.87%), closing at 35.33. The broader market weakness and profit-taking were evident in these stocks.
Sector-specific headwinds and investor caution ahead of major announcements contributed to the downward pressure on these stocks.
| Symbol | Price | Change | Volume |
|---|---|---|---|
| UVIC | 9.71 | -1.08 (-10.01%) | 107,496 |
| OML | 35.33 | -3.87 (-9.87%) | 502 |
| SNAI | 30.14 | -3.29 (-9.84%) | 3,273 |
| PIL | 3.07 | -0.30 (-8.90%) | 284,796 |
| SML | 30.15 | -2.63 (-8.02%) | 3,911 |
| PMRS | 400.71 | -34.90 (-8.01%) | 305 |
| SRVI | 1,437.44 | -111.56 (-7.20%) | 10,438 |
| PMPK | 733.76 | -56.00 (-7.09%) | 958 |
| RICL | 12.01 | -0.84 (-6.54%) | 1,501 |
| FPRM | 8.47 | -0.57 (-6.30%) | 144,646 |
ALLSHR Index Performance (January 15, 2025)
The ALLSHR Index concluded its trading session on January 15, 2025, with a marginal decline of 120.00 points (-0.17%), closing at 71,318.13. The index recorded an intraday high of 72,051.10 and a low of 71,237.75, reflecting a narrow trading range. Volume traded stood at 658,482,169 shares, showcasing active market participation despite the slight downturn. The ALLSHR Index’s year-to-date (YTD) change remains at -1.18%, while its impressive 1-year change of 64.16% highlights strong long-term growth.
Check out the Top 10 PSX Brokers for December 2024
KSE-30 Index Performance (January 15, 2025)
The KSE-30 Index saw a decline of 99.16 points (-0.27%) on January 15, 2025, closing at 36,003.11. The index fluctuated within a day range of 35,871.10 to 36,390.46, reflecting subdued market activity compared to its previous close of 36,102.27. Trading volume rose to 157,638,191 shares, signaling active investor engagement. The index’s YTD performance now stands at -0.50%, while its 1-year change remains robust at 67.08%, indicating long-term resilience amidst short-term fluctuations.
KMI-30 Index Performance (January 15, 2025)
The KMI-30 Index experienced a decline of 1,162.95 points (-0.66%) on January 15, 2025, closing at 175,999.21. The index oscillated within a range of 175,514.54 to 178,851.54 during the trading session, showing notable intraday volatility. Trading volume reached 195,771,266 shares, highlighting significant activity. The year-to-date change for the index stands at -1.48%, reflecting a cautious start to the year. However, the 1-year change remains strong at 61.77%, signaling sustained long-term investor confidence.
Comparison with January 14, 2025
Compared to January 14, 2025, the KSE 100 Index declined by 308.46 points, reversing its previous day’s gain of 574.10 points. While market volume saw a slight increase from 258.81 million shares to 263.60 million shares, investor sentiment appeared more subdued today.
On January 14, the index recorded a high of 115,044.79, slightly lower than today’s high of 115,773.39. The increased volatility and narrow day range reflect uncertainty as investors assess global and local economic factors.
Check out the PSX Performance for 17-Jan-2025
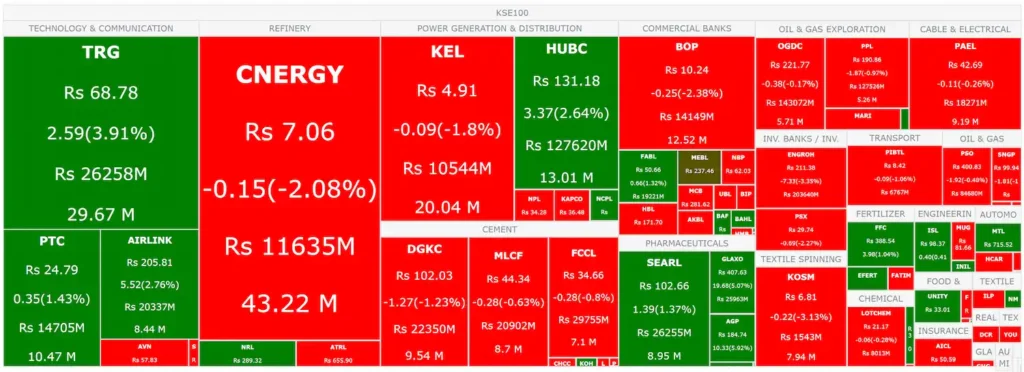
PSX Heat Map Today 15-Jan-2025
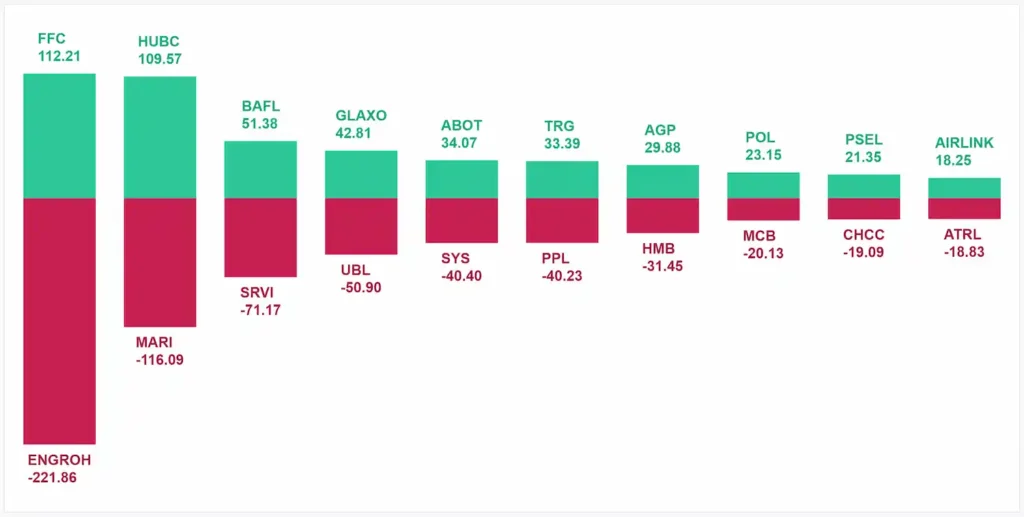
Top Point Contributors PSX KSE100 Index: 15 January 2025
Market Wrap by JS Global Capital Limited: 15 January 2025
Market Wrap by K-Trade: 15-Jan-2025
Conclusion and Strategy for Next Day
Today’s mixed performance indicates a cautious sentiment among investors, influenced by both local and international market dynamics. For the next trading session, investors should monitor sector-specific trends and global commodity prices, particularly in oil and gas. Additionally, keeping an eye on corporate earnings and government policy updates will be crucial for short-term strategies.
FAQs: Stock Market Performance 15-Jan-2025
Profit-taking and sector-specific headwinds contributed to the slight decline.
WTL led the activity with 68,666,714 shares traded.
Investors should track global commodity prices, corporate earnings, and government policy updates for informed decision-making.
Disclaimer
The information provided in this analysis is for educational and informational purposes only. It does not constitute financial advice or a recommendation to buy or sell securities. Investors should conduct their own research or consult with a licensed financial advisor before making any investment decisions. Market conditions are subject to change, and past performance is not indicative of future results.

