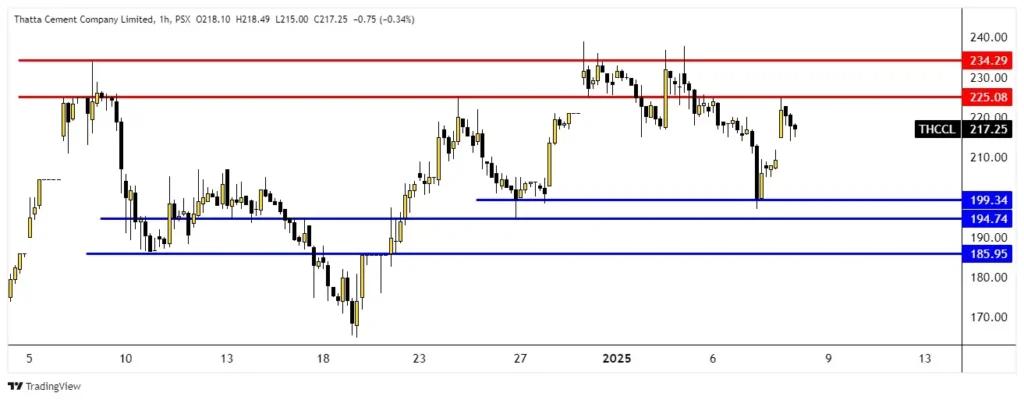
Analyzing Thatta Cement: The daily chart of Thatta Cement Company Limited (THCCL) on the Pakistan Stock Exchange (PSX) offers a comprehensive view of the stock’s medium-to-long-term price behavior. As of the most recent trading session, THCCL is trading at 217.25 PKR, reflecting a minor decline of 0.34%. The chart highlights significant support and resistance zones, which are crucial for traders and investors to monitor.

Analyzing Thatta Cement Key Resistance Levels
Resistance levels represent areas where selling pressure has historically outpaced buying interest, creating potential reversal points.
- Primary Resistance at 225.08 PKR
- This level has acted as a ceiling multiple times in recent trading sessions. The price tested this area but failed to break through, indicating strong selling interest.
- A daily close above 225.08 PKR could pave the way for a bullish rally, with the next target being the major resistance level at 234.29 PKR.
- Major Resistance at 234.29 PKR
- This zone marks a critical long-term resistance. The price previously reversed sharply from this level, making it a key area to watch for profit-taking or selling pressure.
- A sustained breakout above this resistance could signal a strong upward trend, potentially attracting new buyers into the market.
Key Support Levels
Support levels serve as zones where buying interest has historically outweighed selling pressure, preventing further price declines.
- Immediate Support at 199.34 PKR
- This level is an essential short-term support where the stock previously found stability. A retest of this level could offer a potential entry point for buyers looking for a rebound.
- Intermediate Support at 194.74 PKR
- This is a critical zone of interest, as the price bounced back strongly from this level in previous sessions. A breakdown below this support could trigger a deeper correction.
- Major Support at 185.95 PKR
- Serving as a strong base, this support level is vital for maintaining the stock’s bullish structure. Any breach below this level could lead to a significant bearish trend.
Analyzing Thatta Cement Technical Observations
- Trend Analysis
- The stock has been trading within a range, with 234.29 PKR as the upper boundary and 185.95 PKR as the lower boundary. This consolidation reflects indecision among market participants.
- Volume Trends
- Volume spikes near resistance levels, such as 225.08 PKR, suggest that sellers are active. Conversely, buying interest seems to emerge near 194.74 PKR, highlighting strong support zones.
- Potential Breakout or Breakdown
- A breakout above 225.08 PKR could attract momentum traders, with 234.29 PKR as the immediate target.
- Alternatively, a breakdown below 199.34 PKR could push the stock toward the next supports at 194.74 PKR or 185.95 PKR.
Trading Strategies
- For Bullish Traders:
- Watch for a breakout above 225.08 PKR with strong volume. Entry above this level can target 234.29 PKR or higher.
- Use 199.34 PKR as a stop-loss level to manage risk.
- For Bearish Traders:
- Look for a breakdown below 199.34 PKR to initiate short positions, targeting 194.74 PKR or 185.95 PKR.
- A daily close below 194.74 PKR could signal further bearish pressure.
Check out the Market Performance: 07-Jan-2025
Conclusion
The daily chart of Thatta Cement Company Limited (THCCL) illustrates a range-bound structure, with clear support and resistance zones. With the current price at 217.25 PKR, the stock is positioned near a crucial resistance level (225.08 PKR) and a potential breakout point. Traders and investors should monitor these levels closely, as they will likely dictate the stock’s next major move.
Combining technical analysis with macroeconomic factors and company fundamentals can provide additional context for making informed decisions. Stay vigilant for price action signals, such as candlestick patterns and volume spikes, to confirm potential breakouts or breakdowns.
Disclaimer: The information provided in this article is for educational and informational purposes only and should not be considered as financial advice. Stock trading and investing involve significant risk, and you should always conduct your own research or consult with a licensed financial advisor before making any investment decisions. The analysis and opinions expressed are based on historical data and technical observations, which may not reflect future market conditions. The author and publisher are not responsible for any losses or gains incurred as a result of using this information.


